 Connect for Humanity
An open knowledge hub by Connect for Humanity
Localisation, made legible for everyone.
Where humanitarian money is promised, where it actually goes, and what it takes to close the gap — the Grand Bargain and the localisation of aid in plain language, with the funding data to back it up. Built for community organisers and foundation directors alike.
Follow the money
A decade ago the Grand Bargain promised 25% of humanitarian funding to local and national organisations, “as directly as possible.” Here is where it actually goes — on the most recent full year of verified data (2024).
Scale: full bar = the 25% Grand Bargain target. Fill = 7.5% actually reaching local & national actors (2024).
A decade of the 25% promise
Direct funding to local & national actors, as a share of total humanitarian fundingA decade in the low single digits. Direct funding to local and national actors has bounced between roughly 1% and 3.6% of total humanitarian funding — never approaching the 25% target, and no higher in 2025 (~$1.2bn) than it was in 2016. (Some years lack comparable data and are not shown.)
Sources: Development Initiatives, Global Humanitarian Assistance Reports — 2016 & 2020 from GHA 2021; 2021 & 2022 from GHA 2023; 2024 & 2025 from GHA 2025/2026 (direct = $1.2bn, first-level funding to local & national actors). Figures are direct funding only, as a share of total international humanitarian assistance; some years lack comparable data and are not shown.
Self-check: how localised is your funding?
For funders, INGOs & foundations. Six quick questions — get a localisation score and concrete next steps. No sign-up, nothing stored, all in your browser.
The Grand Bargain
Two ideas sit at the centre of everything else on this page. If you read nothing else, read these.
What is the Grand Bargain?
A voluntary agreement reached in 2016 between the largest humanitarian donors and aid organisations to make aid more efficient and effective — to get “more means into the hands of people in need.”
It is organised around a set of commitments (its workstreams): among them localisation, cash assistance, transparency, less earmarked funding, and greater participation of affected people. It is a political promise, not a binding law — which is why tracking who actually delivers matters so much.
What is localisation?
Shifting funding, power and decision-making toward local and national actors — the organisations closest to affected communities — instead of routing everything through international intermediaries.
The headline commitment is the “25% target”: at least a quarter of humanitarian funding reaching local responders “as directly as possible.” Nearly a decade on, direct funding has stayed in the low single digits. Local organisations are not less capable — the system was simply never built to find, trust, and fund them.
Where it stands — 2025
The most recent picture, from the Global Humanitarian Assistance Report 2026. The gap between promise and practice is not closing — on the money that matters most, it is widening.
Only $1.2 billion reached local actors directly in 2025 — about 3.6%. Counting money routed through one intermediary raises it to $2.5 billion (8.7%), but truly direct funding stays in the low single digits. Deep donor reductions drove the wider fall: the United States cut its humanitarian funding by 55% and Germany by 36%, together ~88% of the global decline. When budgets shrink, local organisations are cut first and hardest — the opposite of what the Grand Bargain promised.
Humanitarian funding is falling
Total international humanitarian funding, US$ billions−30% in two years. Funding has fallen to a decade low even as needs rise — and local organisations are cut first.
Source: Development Initiatives, Global Humanitarian Assistance Report 2026 (2025 figures, preliminary).
Where the money flows
Two maps, one imbalance: the crises that receive the most humanitarian funding, and the handful of governments that provide most of it. 2024 figures.
Where it goes — largest recipient countries
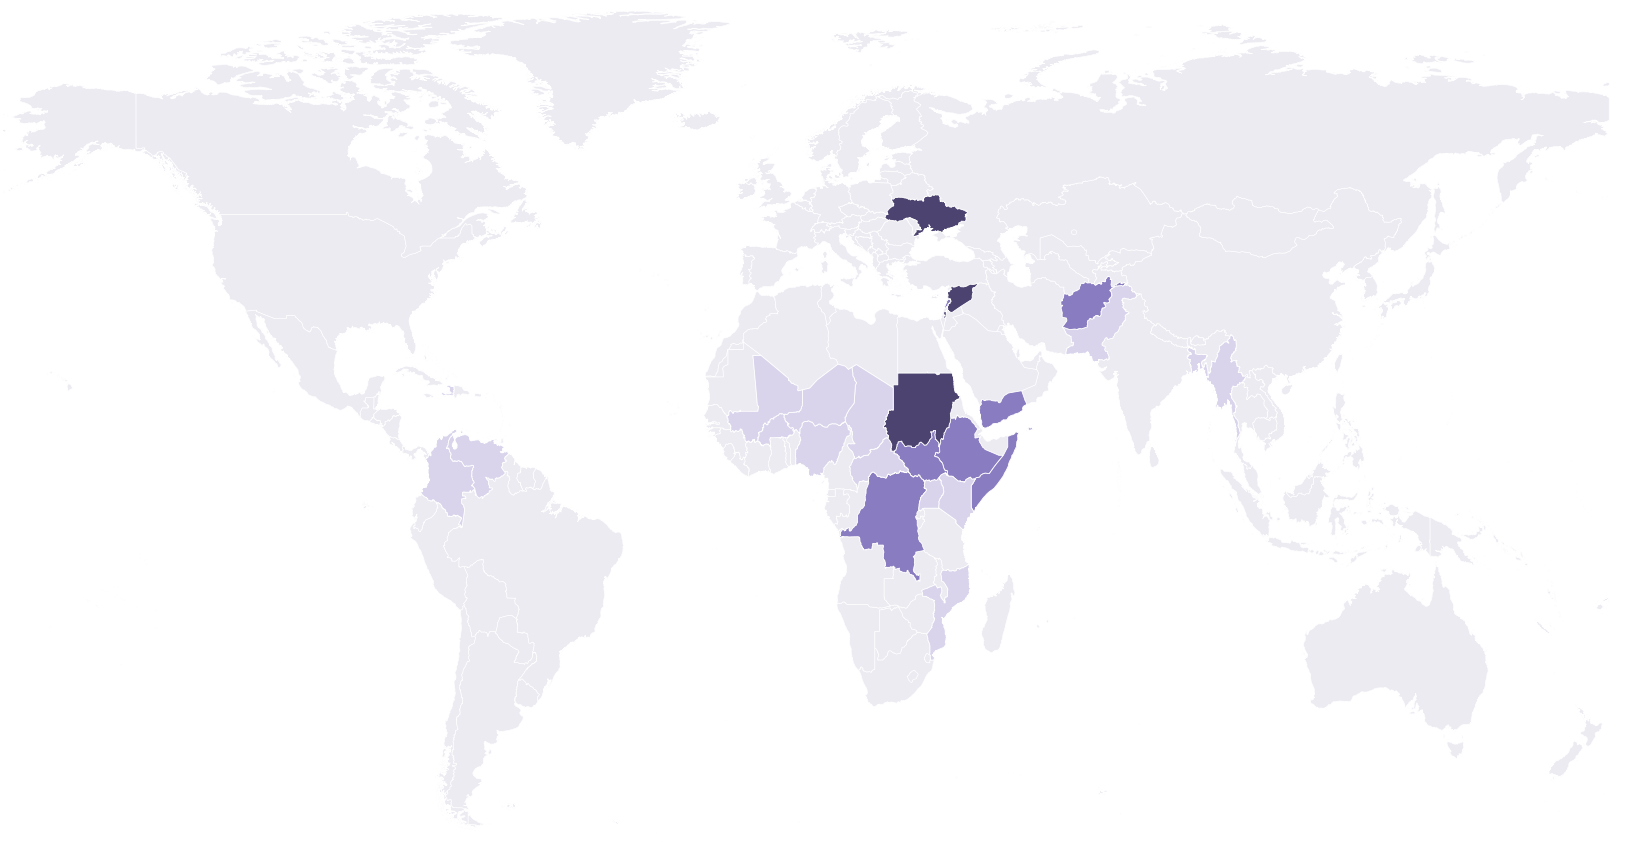
Palestine ($2.9bn), Ukraine ($2.8bn) and Syria ($1.7bn) were the top three in 2024, with Sudan rising sharply.
Who provides it — largest government donors
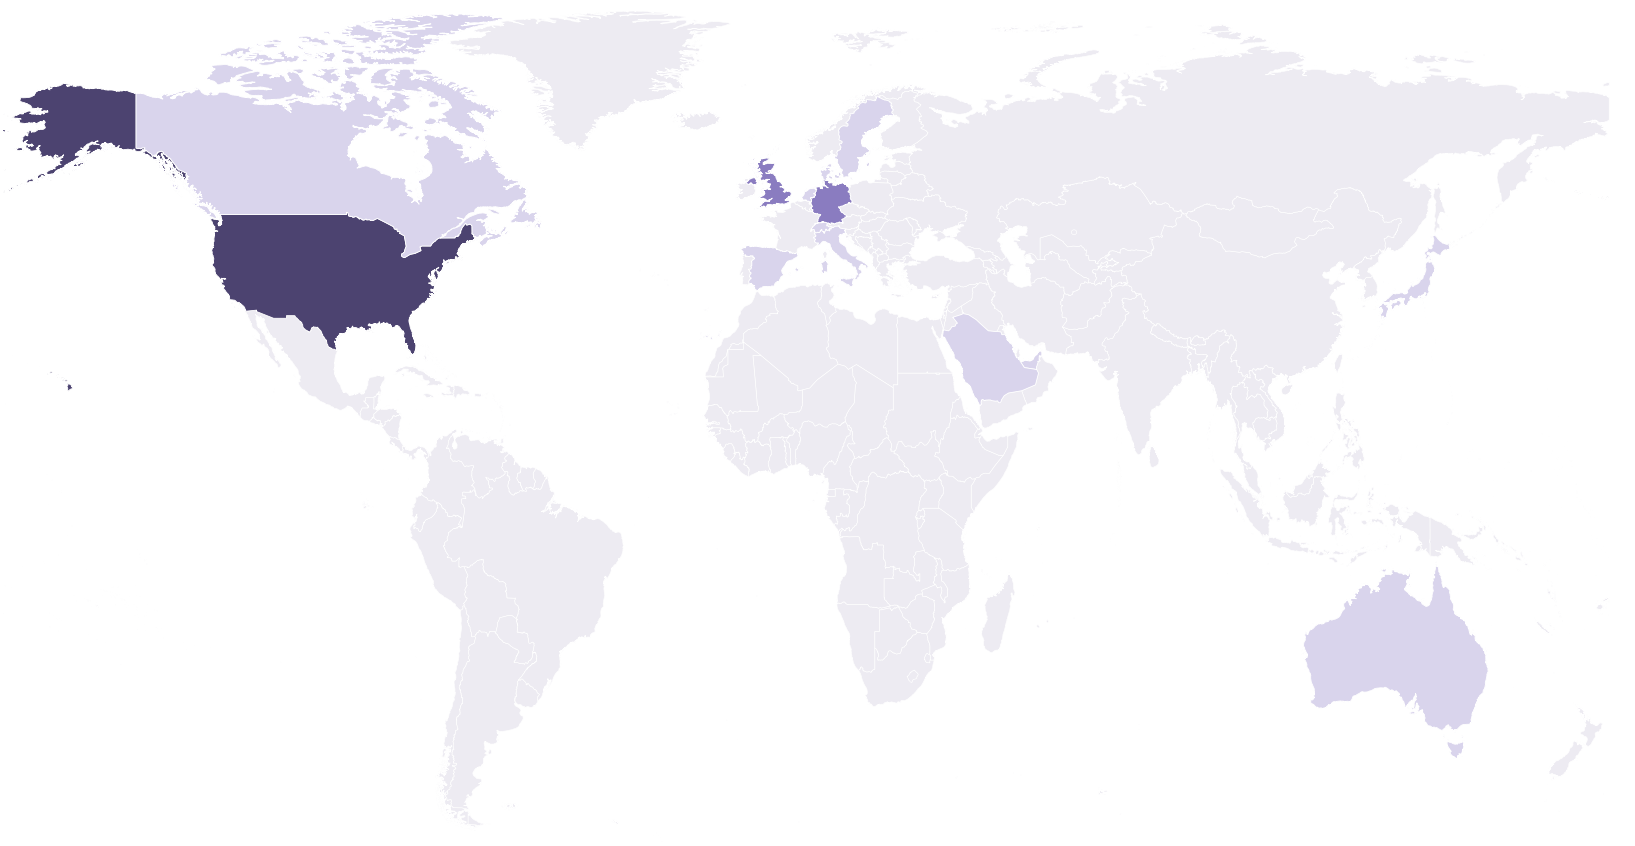
The United States alone provided roughly $15bn — about a third of all humanitarian funding. EU institutions are also among the very largest donors (not shown, as they aren't a single country).
Source: Global Humanitarian Assistance Report 2025 (2024 figures), Development Initiatives / ALNAP; OCHA Financial Tracking Service. Countries are grouped by magnitude, not exact totals.
Frequently asked questions
Plain answers to what people most often ask — the full set lives on its own page. See all answers →
- What is the Grand Bargain in simple terms?
- When and where was it created, and who signed it?
- Is the Grand Bargain legally binding?
- What is the 25% target?
- Has the 25% target been reached?
- Why does so little funding reach local organisations?
- What’s the difference between “localisation” and “locally led”?
- What is the Grand Bargain 2.0 / 3.0?
- Are local organisations really as effective?
- How is progress measured, and who oversees it?
- How can we achieve true localisation?
- What are “local and national actors”?
- What is “quality funding”?
- Direct vs indirect funding — what’s the difference?
- What is a Country-Based Pooled Fund (CBPF)?
- How can a locally-led organisation get funded?
- What can a funder do to support localisation?
- What happened to humanitarian funding in 2024–2025?
Document library
Primary sources and clear explainers. Start with the official texts, then the briefings that make them readable.
The Localization Pledge
Our own public, voluntary commitment for funders to use, promote and finance localization — anchored in the Grand Bargain.
The Grand Bargain — official page
The authoritative hub: text, signatories, workstreams and annual reports.
The Grand Bargain Explained
ICVA briefing paper — the clearest short introduction to what it is and why it matters.
Localisation Workstream
The dedicated home of the localisation commitments, hosted by the IFRC.
Localization — UN OCHA
The UN’s overview of localisation in humanitarian coordination and financing.
Grand Bargain signatories
The official, current list of the 60+ donors, UN agencies and NGOs that have signed.
Financial Tracking Service (FTS)
OCHA’s live database of humanitarian funding flows by country, donor and year.
Resources & links
Trusted places to go deeper — the institutions, networks and explainers that shape the localisation agenda.
Official bodies
Networks & explainers
Glossary
The terms you’ll meet across this library, in one line each.
- Grand Bargain
- The 2016 agreement between major donors and aid organisations to make humanitarian aid more efficient, effective and locally led.
- Localisation
- Shifting funding, power and decisions toward local and national actors closest to affected communities.
- LLO — Locally Led Organisation
- An organisation rooted in and led by the community it serves, setting its own agenda.
- CBO — Community-Based Organisation
- A local group formed by and working directly within a specific community.
- L/NA — Local & National Actor
- The umbrella term used in funding data for non-international responders.
- The 25% target
- The pledge to route at least a quarter of humanitarian funding to local actors “as directly as possible.”
- Vetting / due diligence
- Checks a funder runs before partnering — often duplicated across partners, a major barrier for local groups.
- Quality funding
- Flexible, less-earmarked, multi-year funding that lets responders act on real needs.
- IASC
- The Inter-Agency Standing Committee — the forum coordinating humanitarian action, under which the Grand Bargain sits.
- Participation revolution
- The Grand Bargain commitment to include affected people in decisions about the aid they receive.